Mobile game and app studios have long used the ROAS/ROI metric to measure user acquisition returns, make investment decisions, and value their studios. But, ROAS/ROI is a meaningless metric unless it is framed with the context of time.
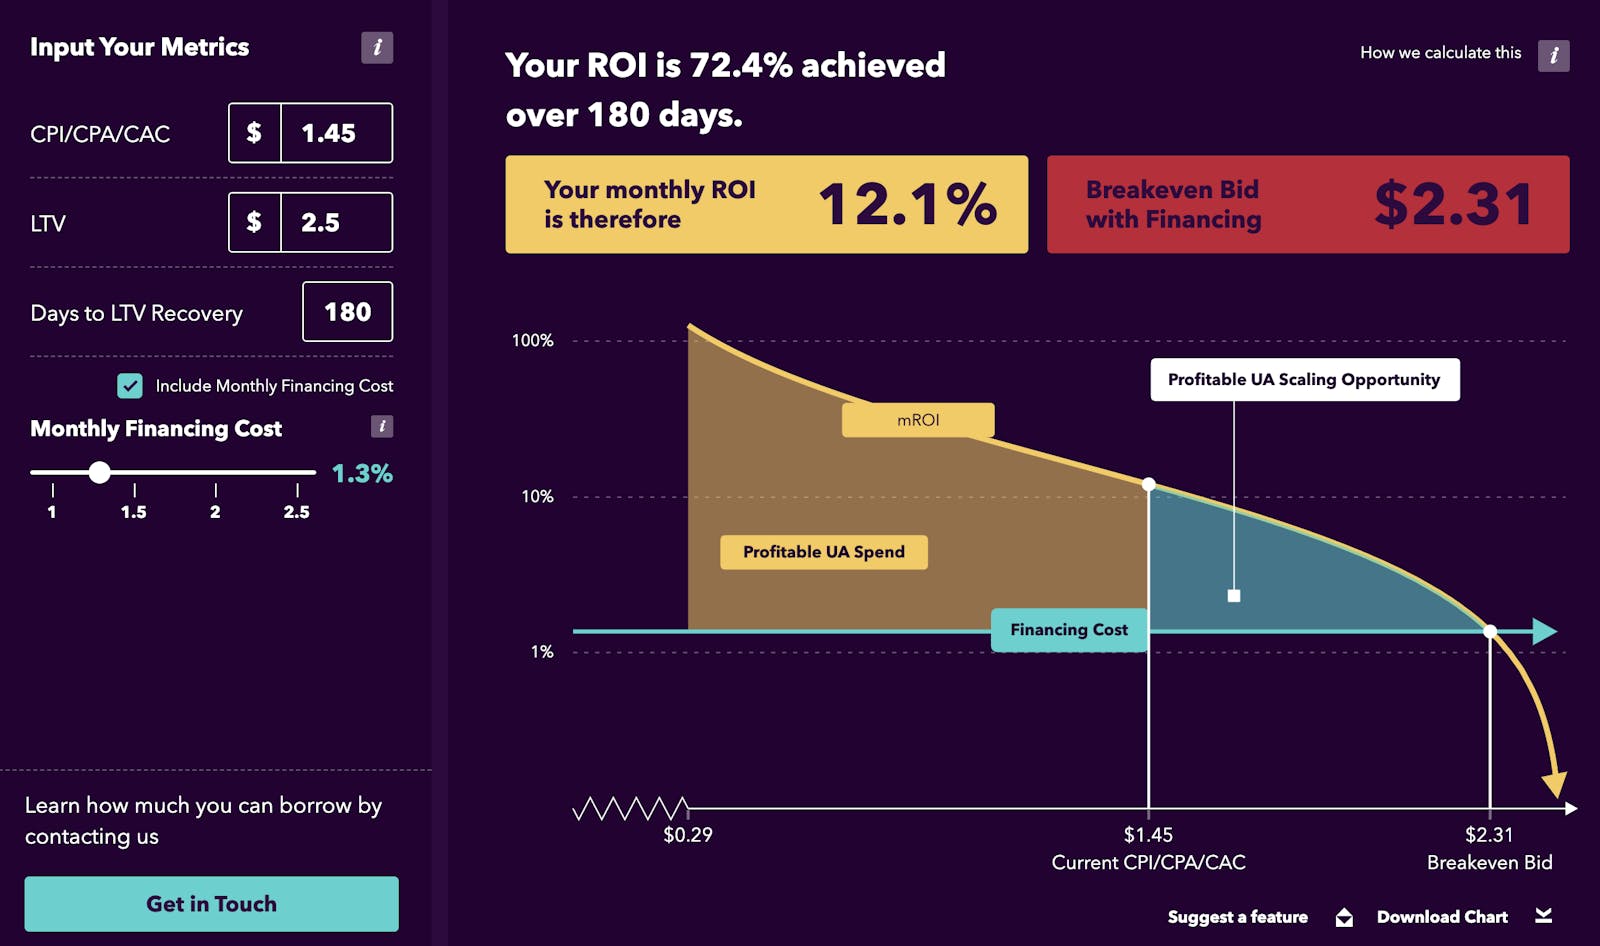
Instead of highlighting problems with no solutions, we've launched the new mROI calculator to enable marketers to look at LTV return horizons and provide them with a framework which breaks financial returns down to a monthly ROI metric. This helps mobile marketers better understand the return profiles of different UA scenarios across different channels and genres and allows them to make more informed decisions by comparing financial return metrics on a like-for-like basis.
Different genres of mobile games and apps have very different return profiles, both in how long it takes to break even on the ad spend (achieve 100% ROAS), and how long it takes to ultimately recover the lifetime value (LTV) of the user and generate profit on ad spend. For example a short LTV game with a 130% ROAS (30% ROI) over 60 days has a substantially different financial return profile to a long LTV game with a 140% ROAS (40% ROI) over 360 days, when measured on a monthly returns basis.

The calculator figures out a monthly return on capital metric regardless of the length of the LTV cycle so that a UA manager can understand a normalized metric for financial returns using a common denominator for comparison.
The mROI metric makes it possible for product teams and UA managers to figure out the best genre of games or apps to create for, where return horizons can be optimized for risk, reward, and financial returns.
Using mROI as a metric also makes the cost/return calculation simple when introducing debt products into the funding mix. Interest costs of servicing debt, for example on a revolving credit facility, can be easily compared against the financial return provided by the ad spend across the same time horizon. For example, if a game has a 1% monthly cost of capital, and an 8% mROI on ad spend, the mROI adjusted for cost of financing is 7% - the 8% return minus the 1% cost of funding. By breaking the calculation out, it becomes simple for finance teams and UA managers to understand how to safely introduce leverage into their business.
The mROI calculator also indicates the potential for additional ROI positive ad spend, as it provides an indication of the maximum bid a UA manager should consider in order to optimize the UA opportunity whilst remaining profitable.
“Measuring ROAS or ROI on ad spend in the traditional way is meaningless without the context of time. We’re committed to helping UA managers and finance teams make sense of their metrics and provide a framework to model financial scenarios and give them confidence in their user acquisition.”, comments Martin Macmillan, Founder and CEO of Pollen VC.
Visit https://pollen.vc/calculators/mroi/ to check out our new mROI calculator and better understand the financial returns of your UA spend.
Pollen VC provides flexible credit lines to drive mobile growth. Our financing model was created for mobile apps and game publishers. We help businesses unlock their unpaid revenues and eliminate payout delays of up to 60+ days by connecting to their app store and ad network platforms.
We offer credit lines that are secured by your app store revenues, so you can access your cash when you need it most . As your business grows your credit line grows with it. Check out how it works!