
When companies start user acquisition for their app, oftentimes they do not commit to hiring a seasoned UA professional right from the get go and instead will dedicate someone internally to build up the framework, conduct initial tests and craft an appropriate UA strategy.
This newly-appointed UA person will be overwhelmed by the amount of information about UA on the internet, most of which lack substance and doesn’t really give the exact steps on how to start.
They will be bombarded with sales emails from various analytics and UA management platform. Finally, ad network representatives would claim that they need to spend tens of thousands of dollars to “train the algorithm” and run campaigns for weeks without adjustments before assessing results.
Here at Pollen VC we are changing this. We are publishing a series of articles on how to manage different aspects of your UA. We put the benefit to our readers above all else, so in this article series you will find concrete actionable items that will allow you to start or improve your UA practice.
Abundance of metrics
The first article focuses on the important metric that you need to track when you are starting out. There are many metrics you can track, and arguably each of them is important. As Eric Seufert puts it,
“Different configurations of metric values can produce success for different products, especially when one considers that the traffic mix for every product is different.”
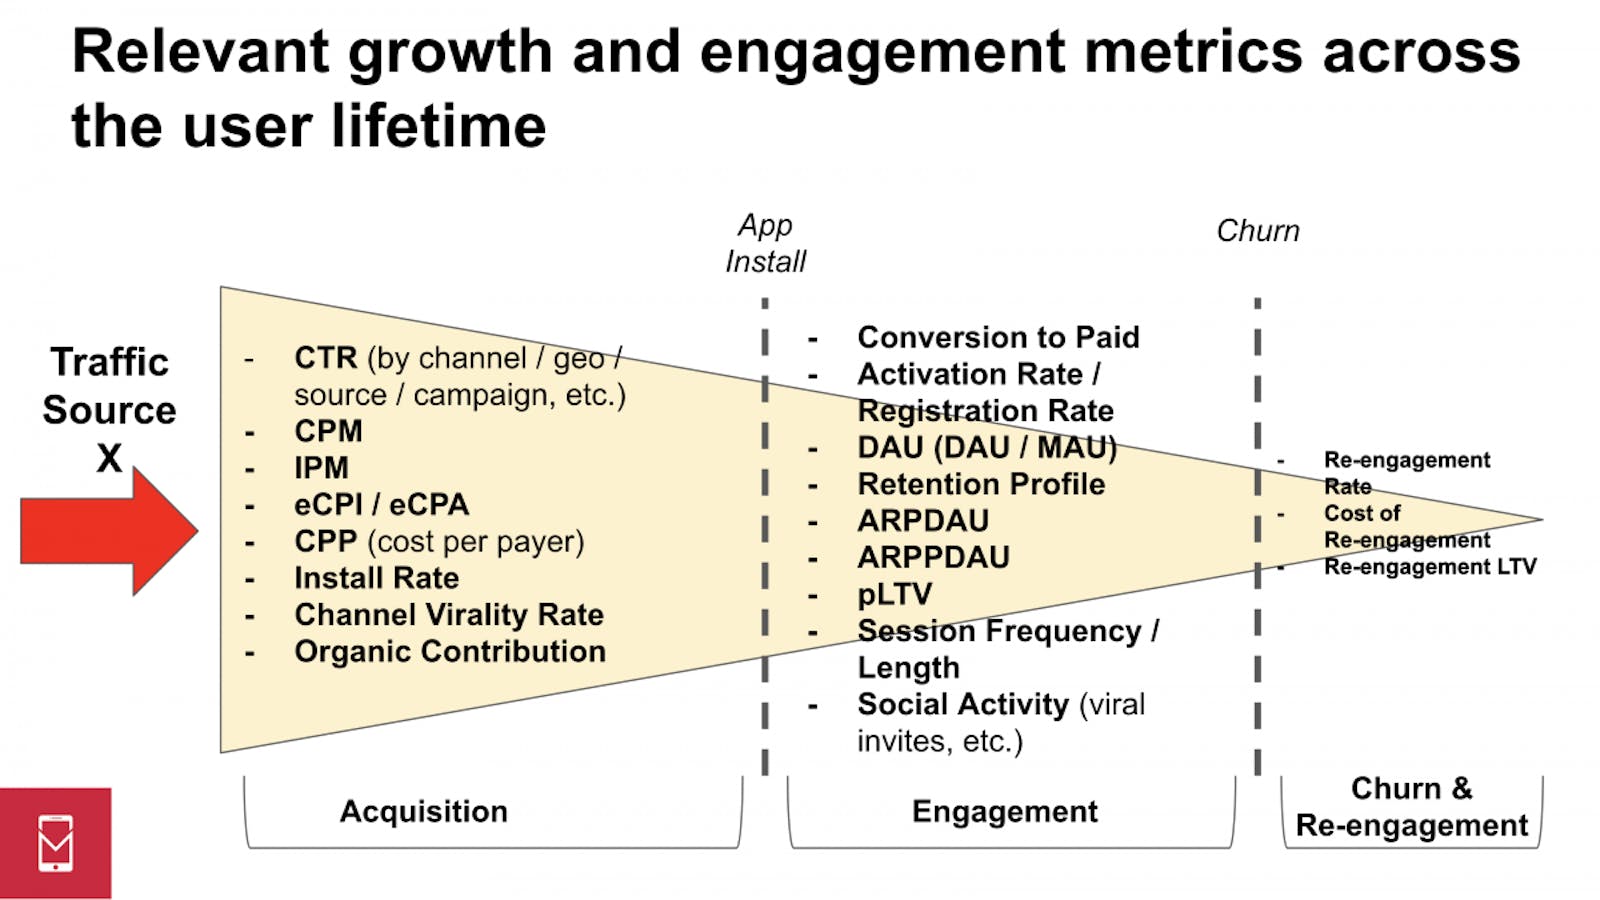
Many of these metrics are trackable in different free and paid analytics systems, such as Facebook Analytics, Appsflyer, etc.
However, the most important bottom line metric has always been ROAS (Return on Ad Spend).
After all, what you care about most is your bottom line. If you don’t have millions of dollars of venture capital money lying in your bank account to build up enormous audiences while losing money for years, then you need your app to have positive unit economics as soon as possible.
And you’d rather scale gradually while maintaining positive returns on UA spend than dump a lot of money into UA hoping to build up virality while losing money on each user. When you are just starting out, the most important thing for you is to breakeven on your ad spend, and this is where ROAS tracking helps a lot as well.
ROAS calculation
The formula for return on ad spend is very simple:
ROAS = Cohort Revenues / Cohort Cost
What does ROAS number give you? It tells you how much money you recouped after you spent it on app install ads. When ROAS equals 1, it means you have recouped 100% of your money, and you can track this metric to figure out your payback period.
You can also track ROAS at different time points. For example, D7 ROAS tells you how much you recoup in a week, and D28 ROAS tells you how much you recoup after a month. This allows you to track your cohort performance closer.
Let’s say you have 0.2 D18 ROAS. Is it good or bad?
It depends. In order to figure this out, you need to estimate your customer’s Lifetime Value (LTV).
For LTV estimation you can check out this Google white paper or even use our own LTV Calculator.
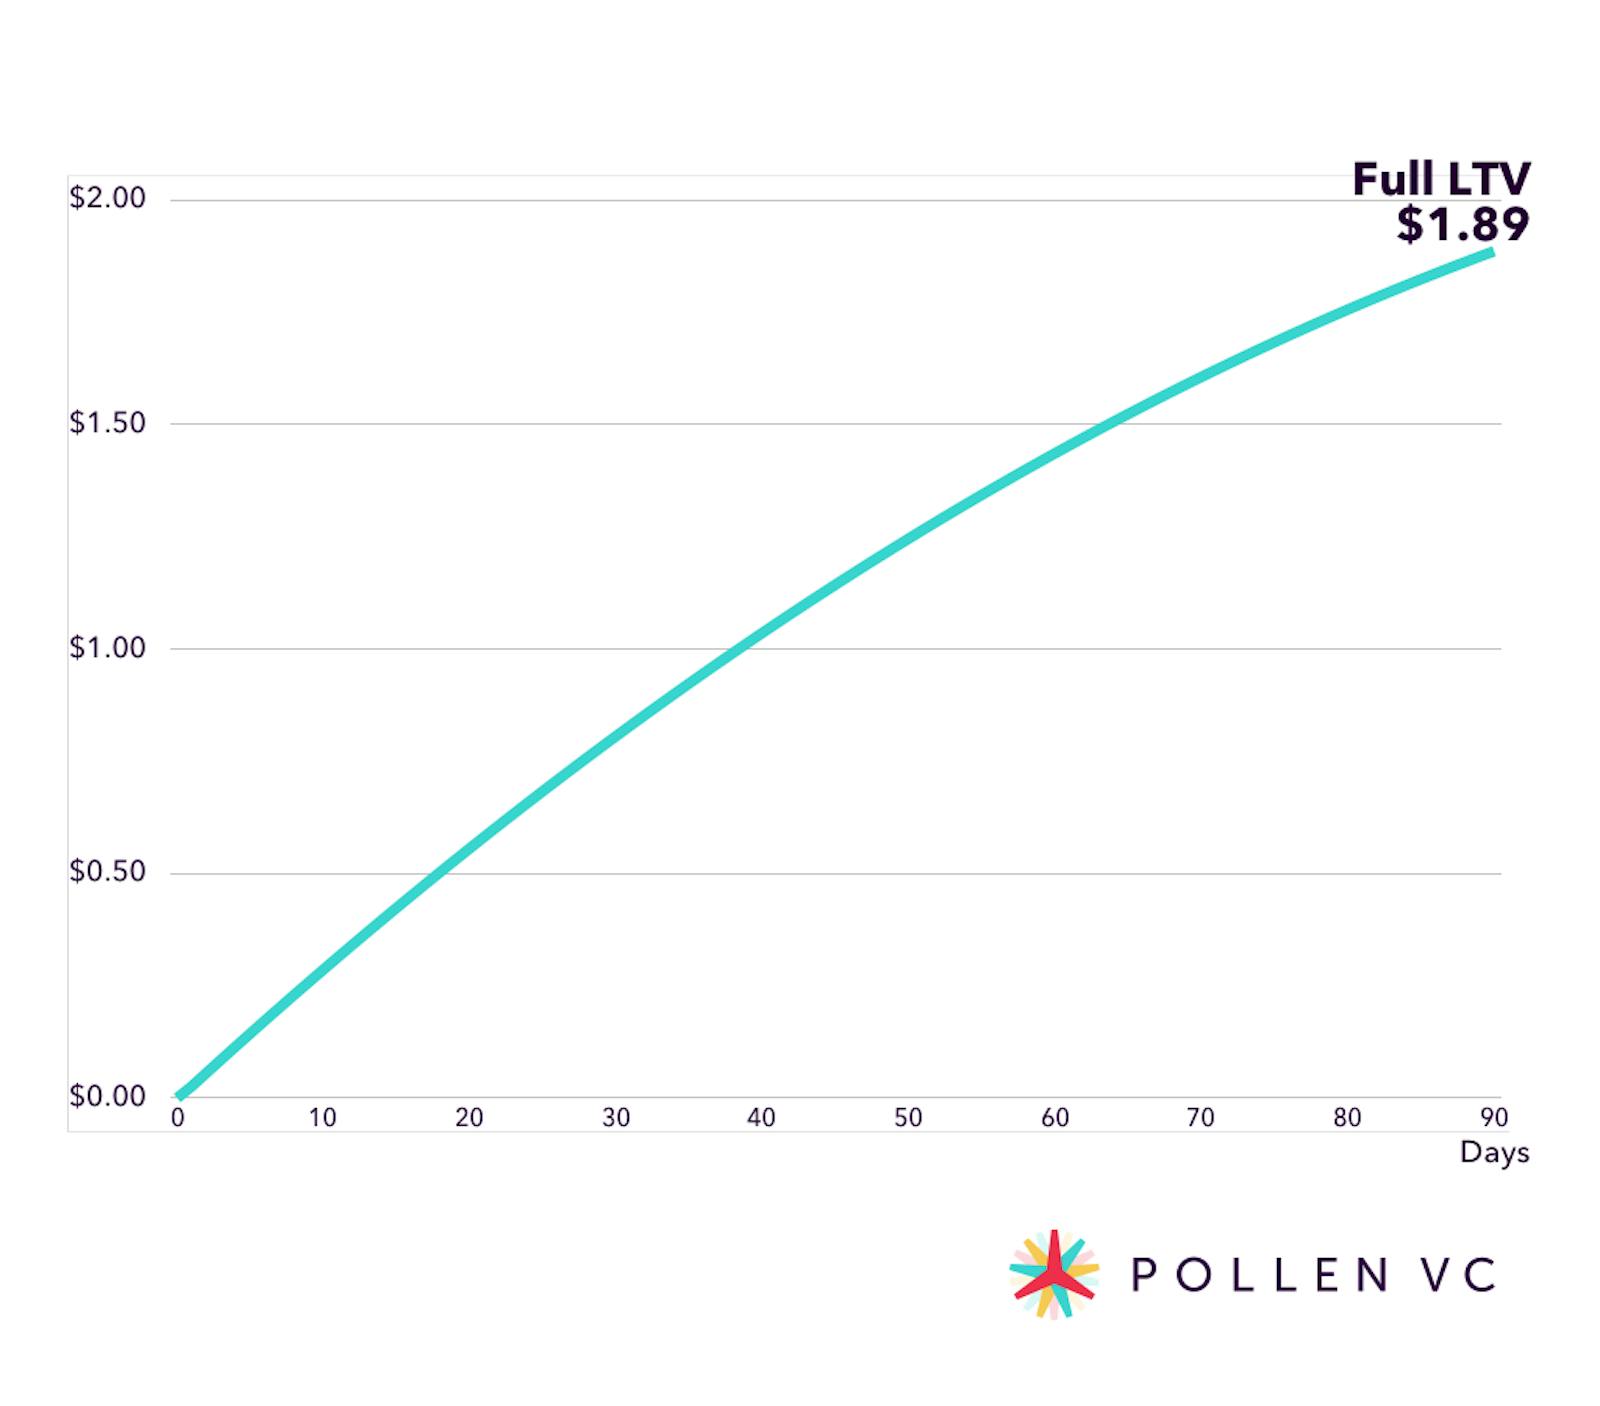
The example above shows a hypothetical app with $1.89 LTV over 90 days. The first step is to normalize the curve. It will effectively transform your LTV curve into a ROAS curve where CPI equals LTV and you break-even at 100% LTV recovery.
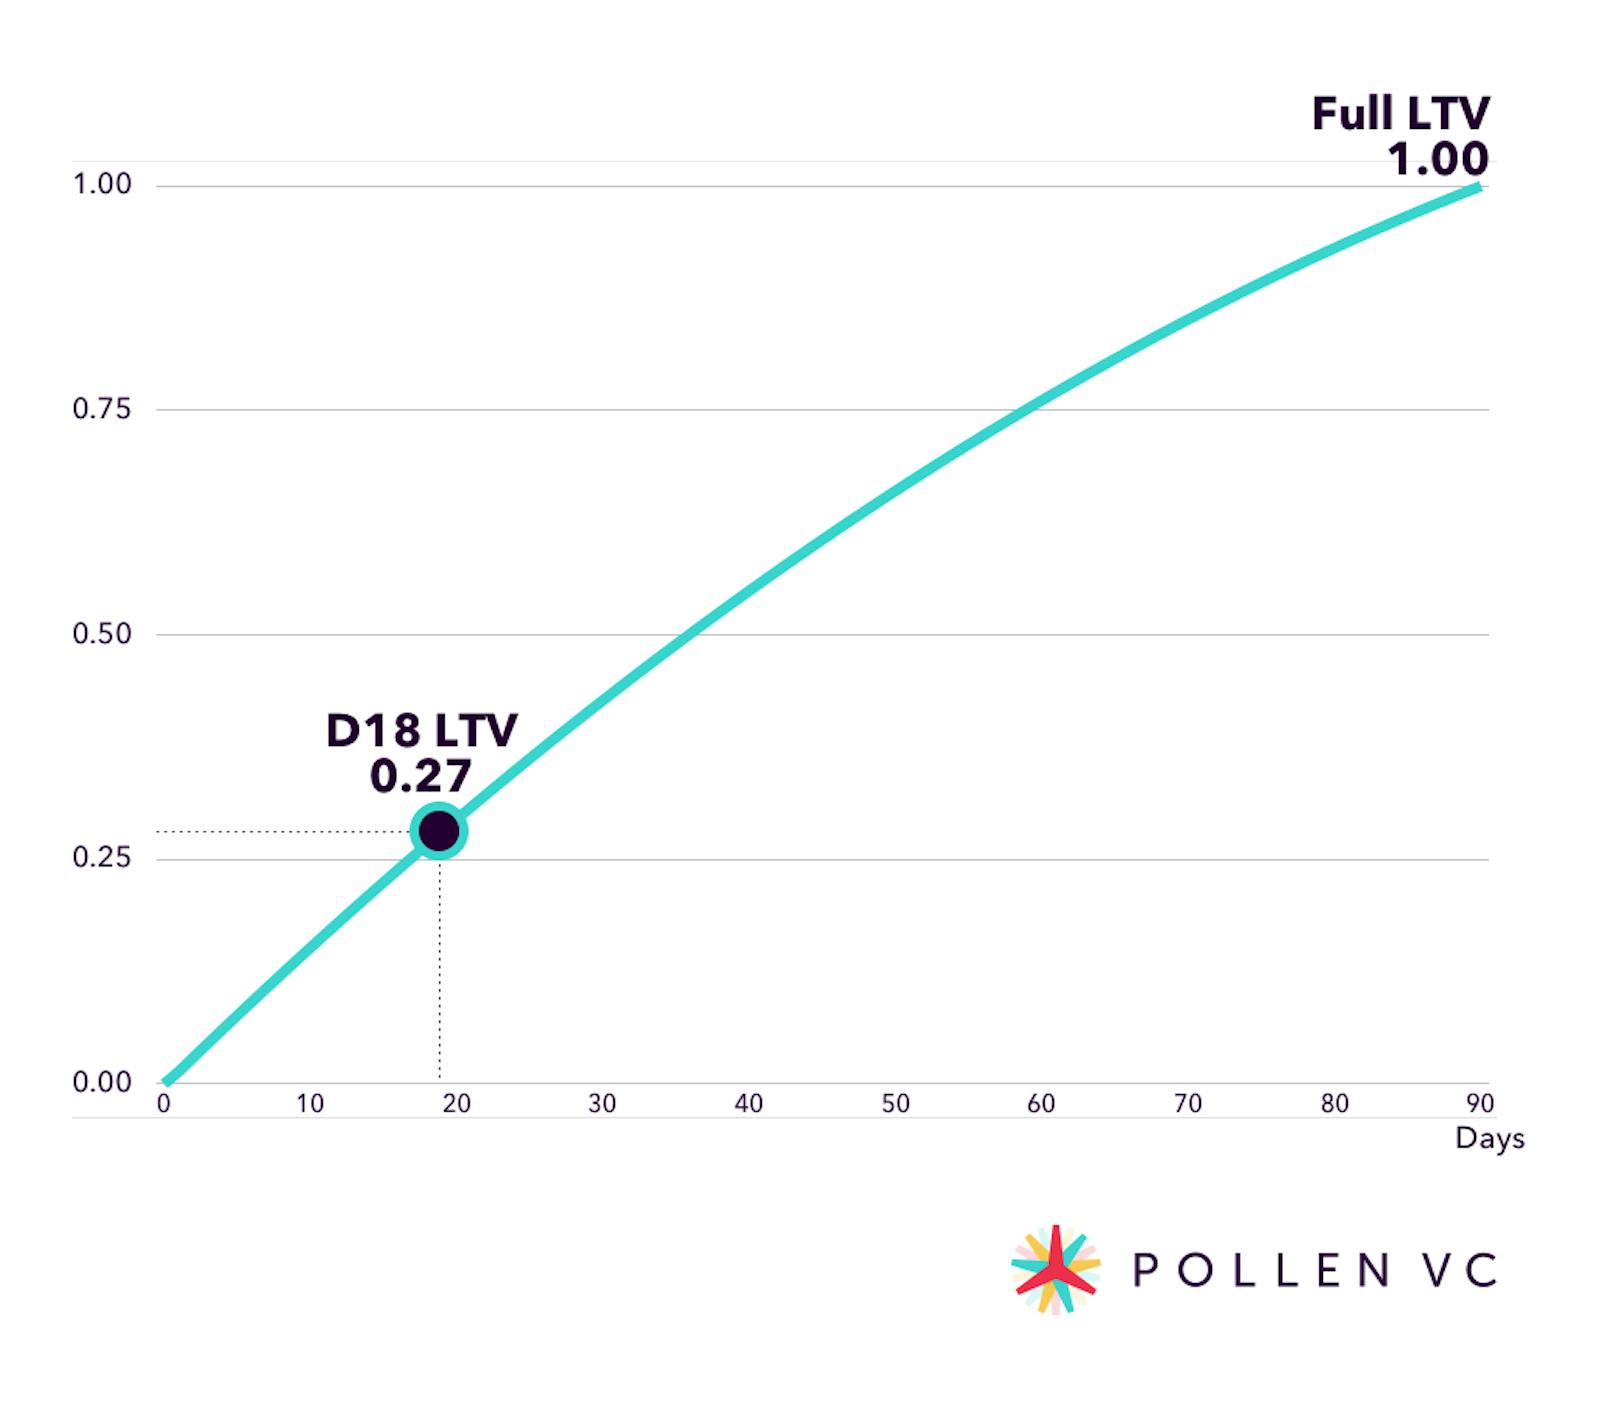
Now we know that in order to “ride the LTV curve”, by day 18 we are supposed to recover 27% of our LTV. Instead, got only 20%. Doesn’t look so good.
An attentive reader will notice that I am comparing two curves which are likely to have different CPI assumptions. For example, for our normalized LTV curve we assumed CPI of $1.89 (equals to LTV), and here we can have CPI of $2.50, which would mean our users are “riding the LTV curve”, but we acquired them for more than we predict our LTV to be.
This warrants the question: should we impose a hard ceiling on CPI that equals to LTV to avoid this? I wouldn't do it right away. Your LTV curve is an average performance of your users, and depending on all the aspects that a campaign can take into account, you may be able to acquire users for more than your LTV and still stay profitable.
For example, you may use a narrow lookalike on your whales together with IAP optimization and acquire users for $4, and they are going to return you $5 over their lifetime. Thus, limiting your CPI bid in practice wouldn't allow you to acquire such users.
How can we resolve this inconsistency?
There are a number of ways to resolve this, and I usually make an assumption about the shape of ROAS curve based on your normalized LTV curve. Then what matters is % of ROAS recovery on a certain day, regardless of whether you acquired users at $1, $2, or $5.
If they deliver at least 27% of their acquisition cost by day 18, you are likely to breakeven by day 90 and get your money back. If they deliver more than that, you are going to speed up your payback window and earn some money.
Mature vs active ROAS
So far we have dealt with cohort-based ROAS by tracking the performance of a certain cohort of users over time. However, often cohort-based reporting is not available or is not precise.
For example, Facebook Ads Manager reports ROAS as a cumulative metric: simply whatever you earned up to today divided by whatever you spent up to today for a given campaign or ad set. This is what is called active ROAS, whereas a mature ROAS stacks up all the cohorts on each other.
Here’s an example. You started a campaign on April 1st, today is the morning of April 19th, and you are looking at the ROAS metric on Facebook Ads Manager. Given that 18 full days have passed, you have a D18 ROAS, but it is going to be an active ROAS.
Why? Because the ROAS that you see blends together the revenues from your first day cohort that has had 18 days in your app, your second day cohort that has been in the app for 17 days, and so on up until the newest cohort that has been in the app for only one day. That is why active ROAS is often called “blended return”, but I prefer the term “active ROAS” since it ties this metric back to the classic cohort-based ROAS.
In fact, you can transform mature ROAS into active ROAS. Here is how you would do it:

To make an example, let’s go back to our previous normalized LTV curve:
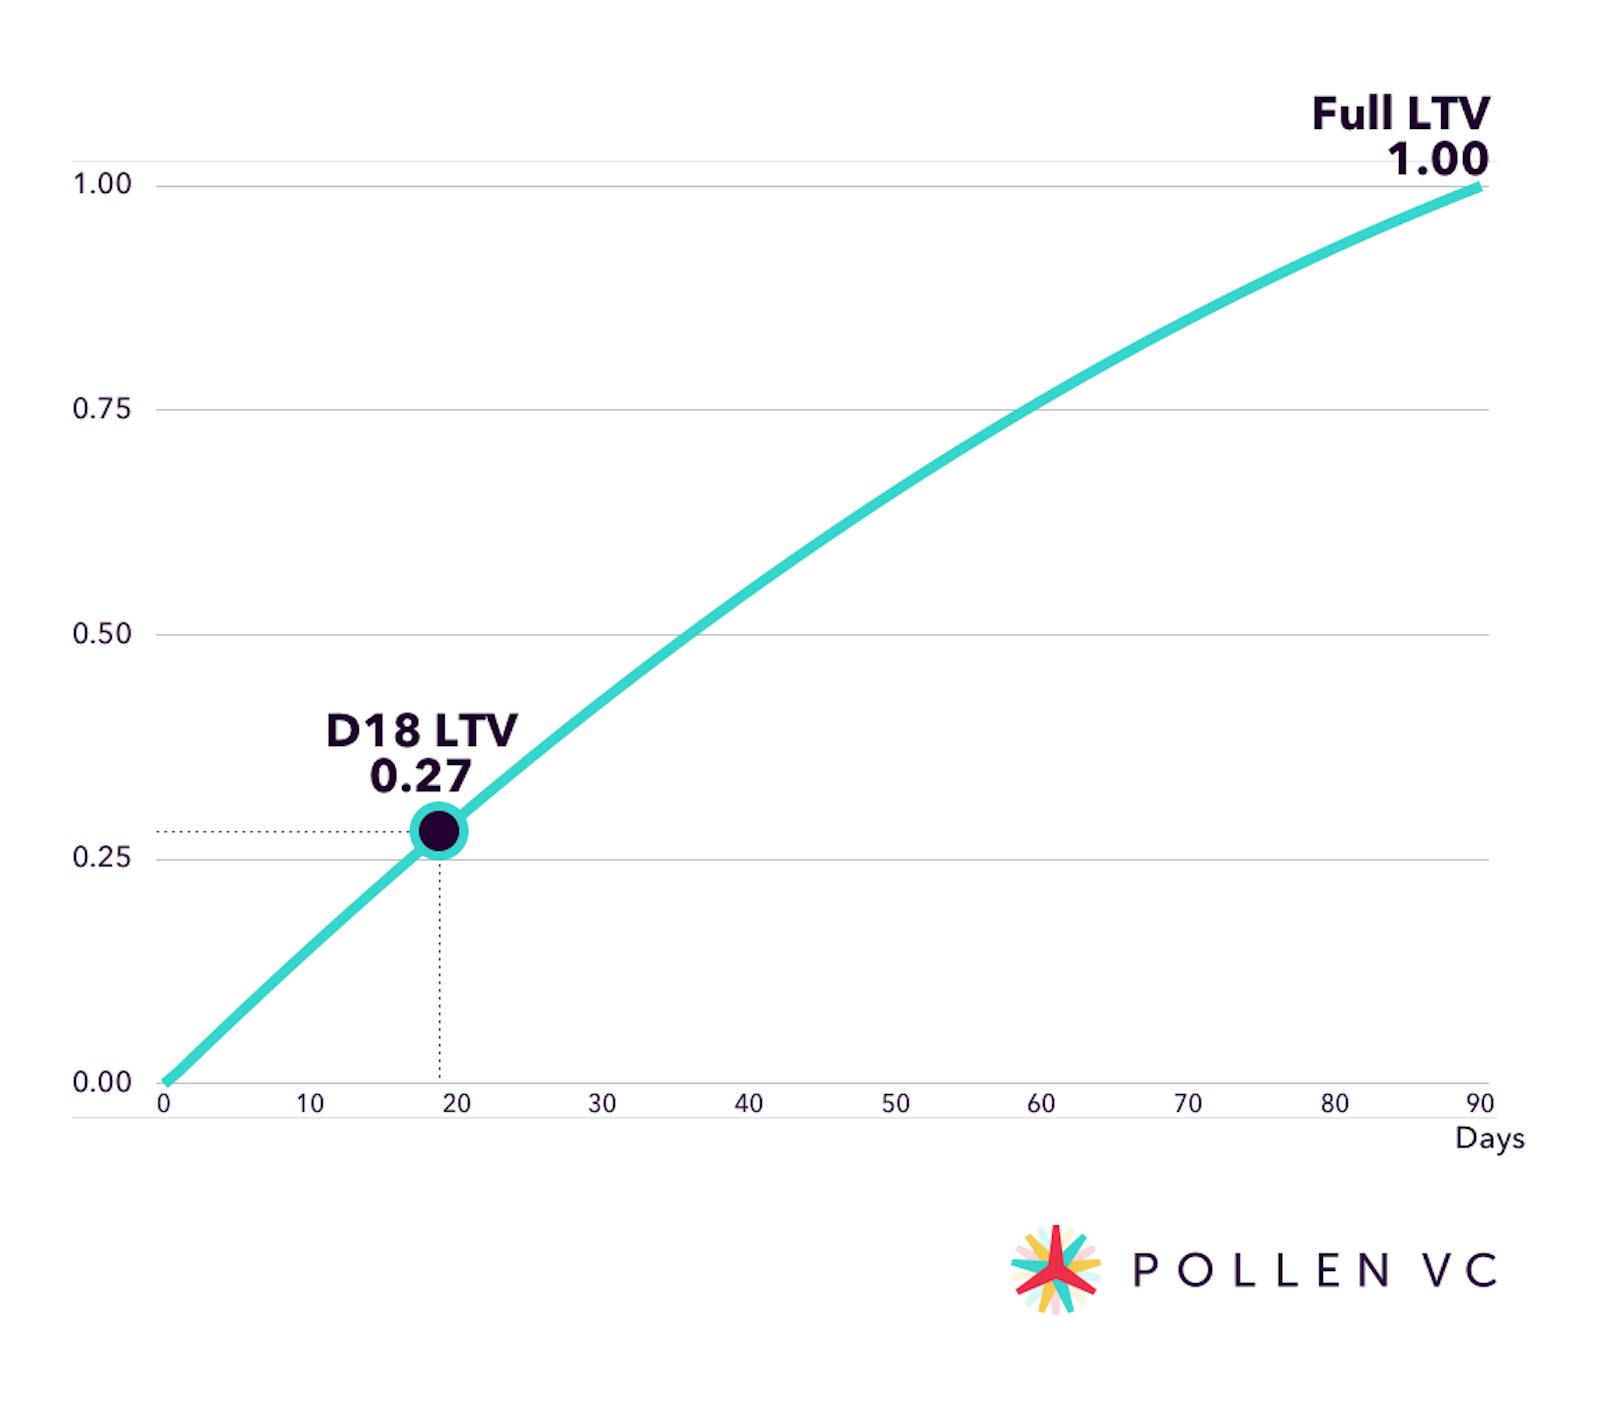
As we can see, D18 ROAS is 0.27. This is mature ROAS, meaning that the cohort or cohorts have all had 18 days inside the app. In order to calculate active ROAS, we need to sum up all the daily ROAS points on the curve until the ROAS day (in our example, 18) and divide them by the ROAS day:
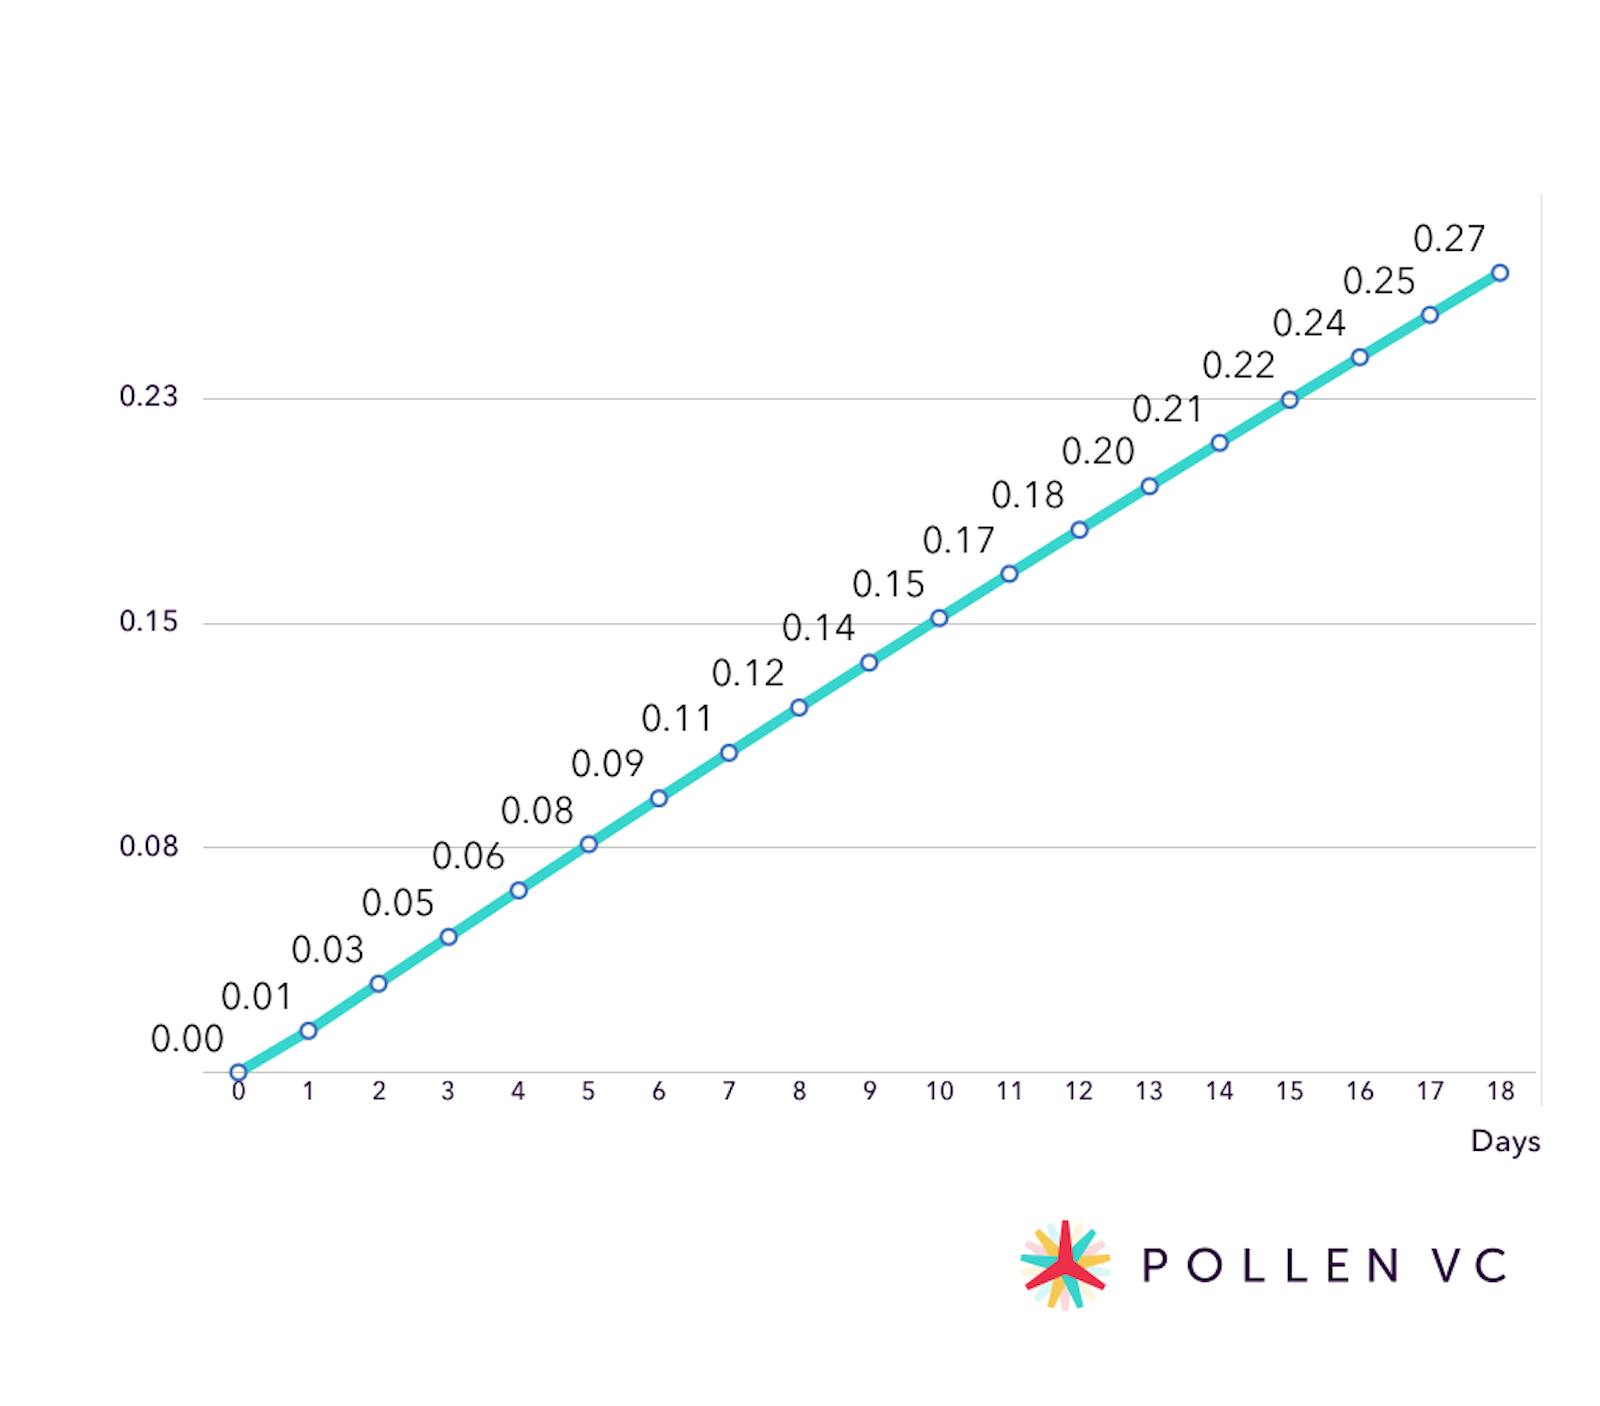
Active ROAS(18) = 2.57 / 18 = 0.14
This means that in order to breakeven on your ad spend, you need to have your D18 active ROAS to be at least 0.14. If it is more than that, you are profitably spending your budget.
Once you identified important active ROAS points, you can easily glance at your Facebook Ads Manager dashboard and immediately assess whether your campaigns are likely to breakeven or not.
It is important to note that this method of passing from mature to active ROAS works best for:
- campaigns with a fixed daily budget.
- campaigns than do not have fully matured cohorts in them (meaning 100% LTV recovery).
For campaigns with budget changes and fully matured cohorts the math becomes a bit more complicated, and we are going to explore this in more detail in one of the next articles.
I hope by this point I have managed to convince you that the ROAS metric is extremely important. Despite the importance of the metric, many advertising panels such as Facebook Ads Manager do not offer a convenient way to track it over time and look back at the performance of the campaign.
Therefore, it becomes extremely important to keep track of your campaigns daily and have your own internal view of how things are going. In our next article, you are going to get access to our UA tracking template.
Pollen VC provides flexible credit lines to drive mobile growth. Our financing model was created for mobile apps and game publishers. We help businesses unlock their unpaid revenues and eliminate payout delays of up to 60+ days by connecting to their app store and ad network platforms.
We offer credit lines that are secured by your app store revenues, so you can access your cash when you need it most . As your business grows your credit line grows with it. Check out how it works!