
New free-to-use mROI calculator
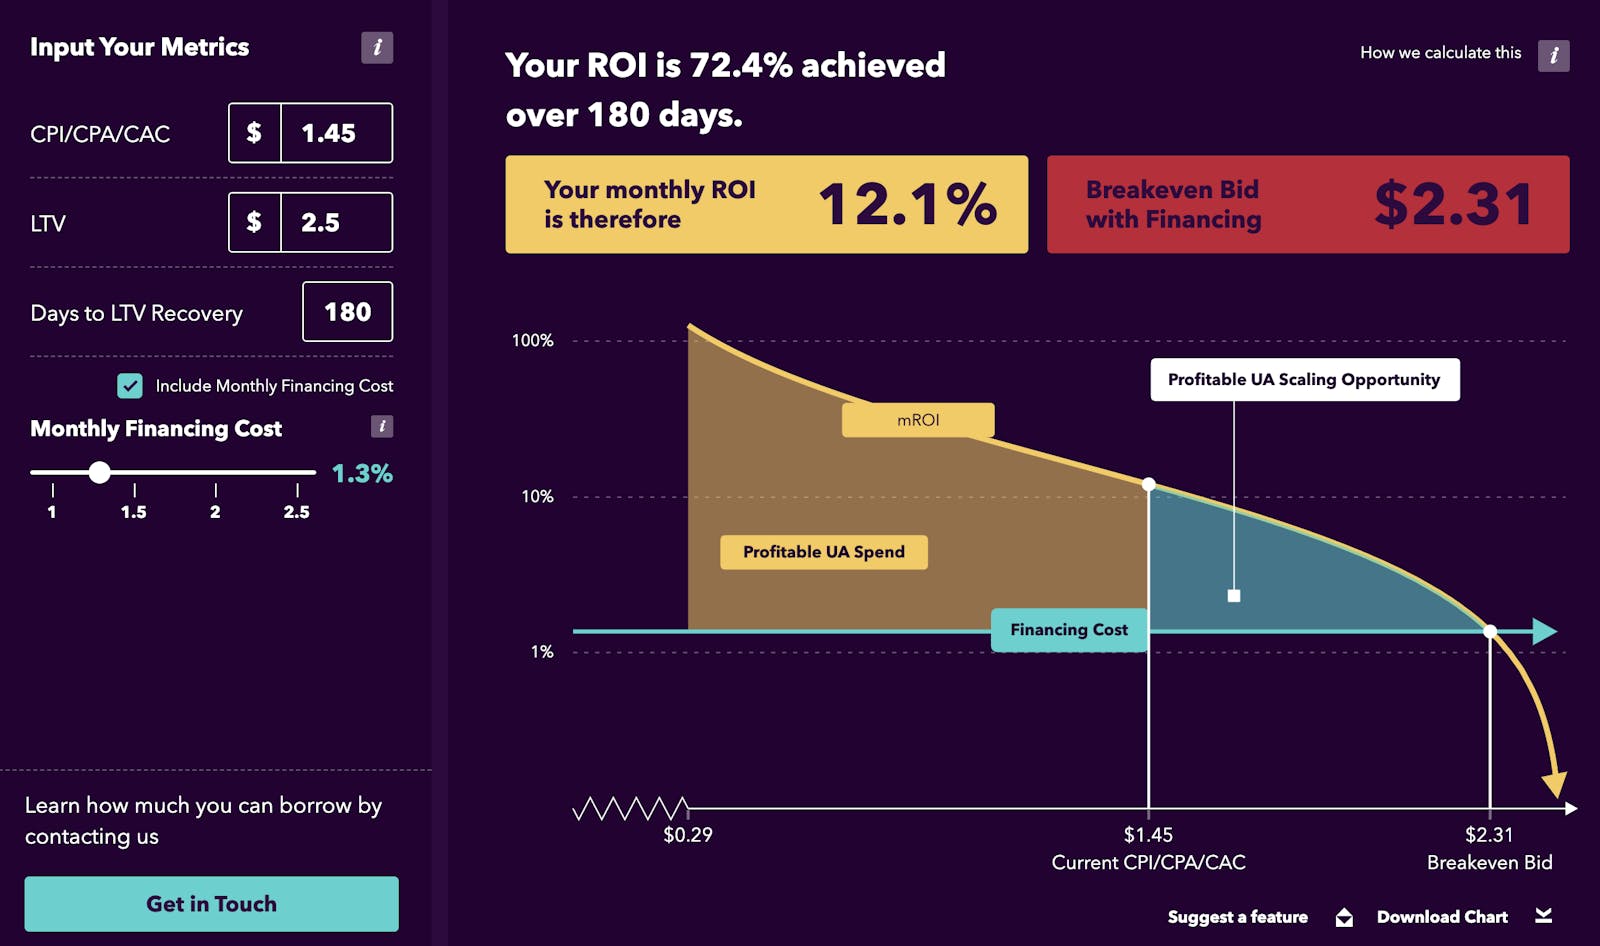
ROAS, LTV, and other UA abbreviations
UA managers focus on achieving a positive ROAS on their ad spend as a key part of their role. Achieving breakeven on their ad spend is important, but without achieving an ultimate return beyond 100% ROAS, the only winners are the ad networks and the studio makes zero profit.
In terms of making informed budget allocations across different UA opportunities, most UA managers focus on the absolute ROAS achieved and do not put a sufficiently strong focus on time to measure the outcome. Without the context of time, ROAS and LTV measurements are somewhat irrelevant.
UA managers together with their finance teams, need to be able to compare different UA opportunities on an even playing field. This may be across different games in a portfolio, or different potential campaigns with different return profiles in different geographies.
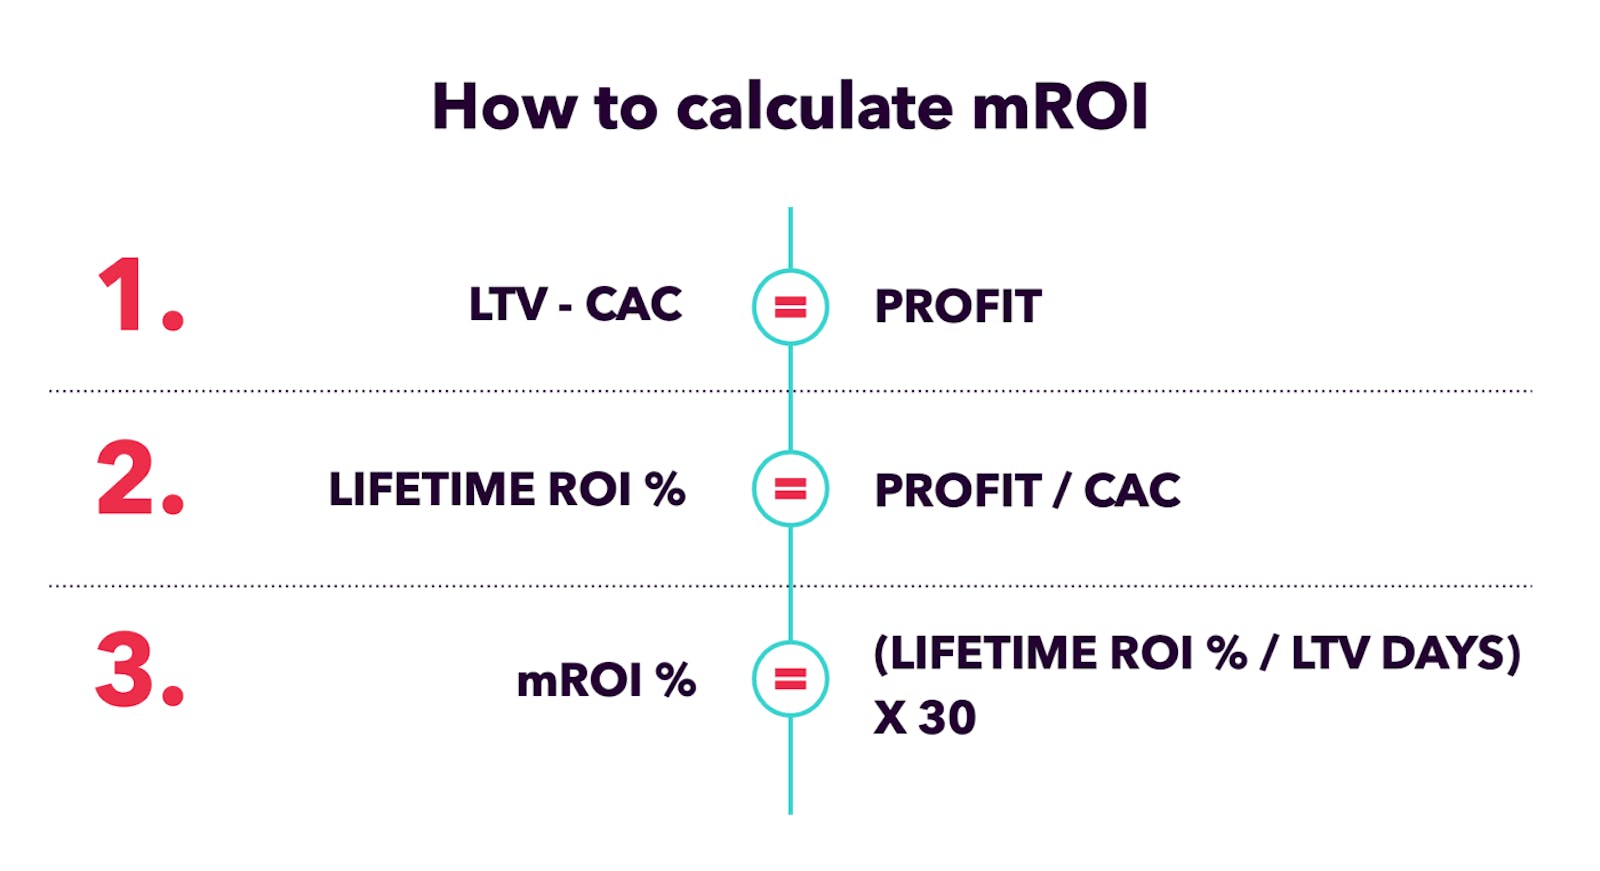
Profit on the UA cycle is defined as LTV minus CAC, but it's important to factor in the time it takes to achieve that return, and provide a framework for comparison against competing user acquisition opportunities to invest in.
Here are two parallel examples which compare returns on mobile games in different genres:
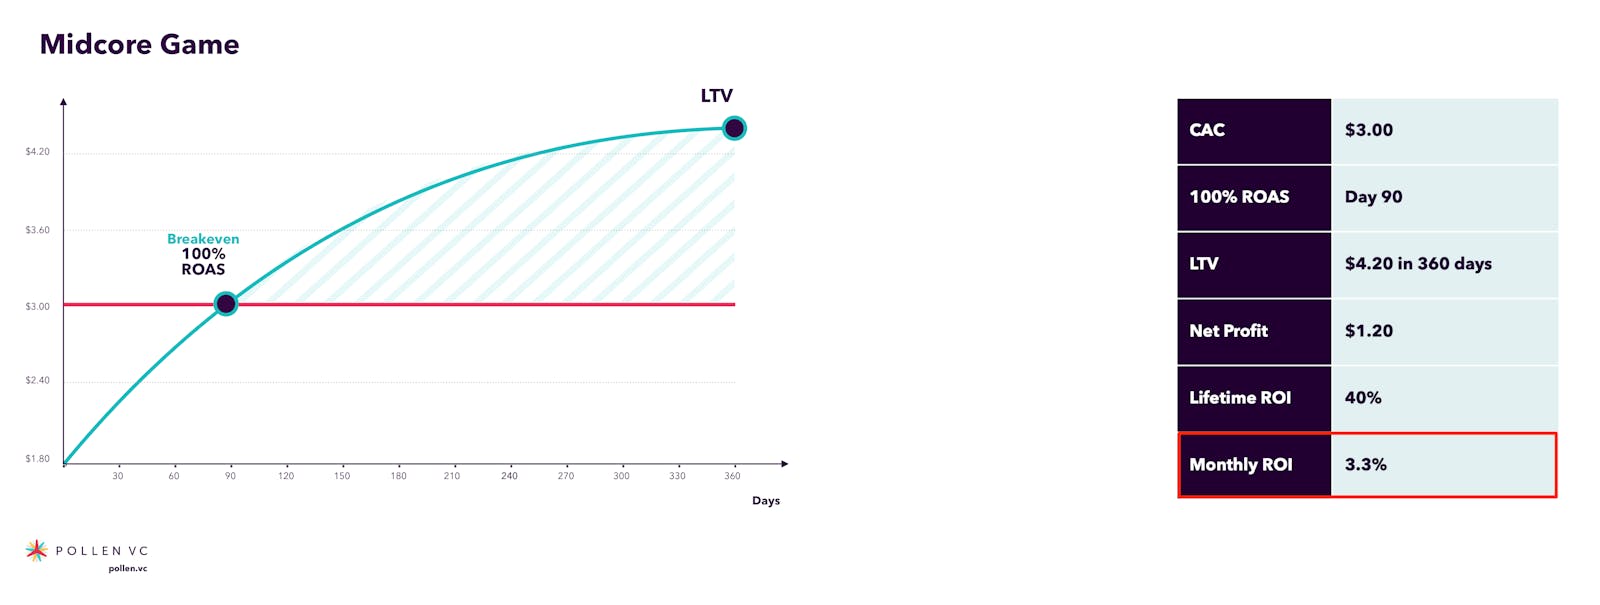
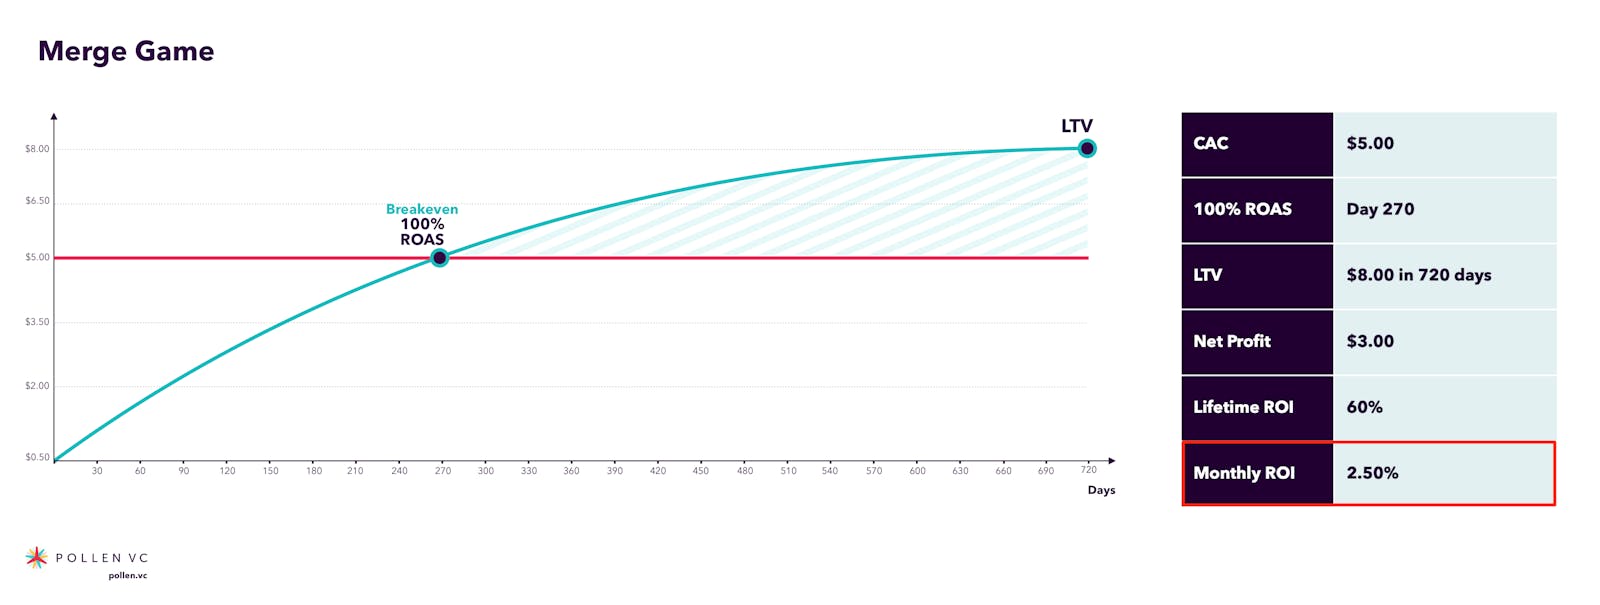
Let's compare the financial return profiles of each. The midcore game makes a 40% ROI over 12 months. In other words, a straight-line return on capital invested of 3.3% per month. The merge game makes an 60% return, but takes 24 months to do so, providing a return of just 2.5% per month.
It's important to compare these different opportunities on a level playing field, so we use monthly return on investment (mROI) as a core metric. This allows for an easy comparison across competing UA opportunities and enables a framework to interface between CFOs and UA managers around budget allocation decisions.
Note: For simplicity this approach ignores the convexity of the LTV curve. For a more rigorous approach, convexity should be factored into your models. See this post on Understanding Convexity in LTV modeling.
Calculating mROI
Fortunately, calculating your mROI metric is pretty straightforward. Essentially you’re looking to figure out your profit on the UA, then express it as a monthly return on investment over the lifecycle of a user journey.
Introducing leverage to scale your game/app
Using mROI as a core metric also makes it a lot easier to figure out the cost vs return if using debt-based financing for additional capital to enable more aggressive reinvestment into UA cycles.
For example, if a studio is using a revolving credit facility to scale their game using debt and the cost of capital is 1.25% per month, it makes it easy to factor in costs vs returns and whether using a revolving credit facility is generating a good return for the studio.
In the example above, the mid-core studio would subtract their monthly cost of capital (1.25%) from the return on capital (3.3%), quoted over the same time horizon, to achieve a return of 2.05% per month after taking account of financing costs, giving the studio a capital efficient way to fund additional UA spend.
Note that it’s very important to be able to calculate cost/return on the same interest rate basis for comparison - something that’s very hard to calculate with fixed fee factoring or revenue based loans, where pricing must be broken down to a monthly interest for comparison.
Summary
Spending money on UA is just like any other capital allocation decision in their business for founders, CFOs or UA managers. Having a framework using a monthly return metric for ROI on ad spend across multiple channels/games enables decision makers to more easily compare competing opportunities side by side and make better informed choices.
Risk should also be taken into account, specifically factors that could impact longer LTV games’ ability to generate a return. The longer dated horizon that LTV is measured over, the greater risk that something happens to upset the ability to return the expected yield. Hence many developers are choosing to focus on building games with shorter ROAS cycles to get a more optimal blend of risk/return on their ad spend.
Pollen VC provides flexible credit lines to drive mobile growth. Our financing model was created for mobile apps and game publishers. We help businesses unlock their unpaid revenues and eliminate payout delays of up to 60+ days by connecting to their app store and ad network platforms.
We offer credit lines that are secured by your app store revenues, so you can access your cash when you need it most . As your business grows your credit line grows with it. Check out how it works!